One dessert that is sure to amaze your dinner guests is the baked Alaska. This classic treat consists of ice cream placed on a bed of sponge cake and covered in meringue. Although the dessert goes into a hot oven to caramelize the meringue, the ice cream inside surprisingly remains frozen. In this blog post, we use the heat transfer simulation capabilities of the COMSOL Multiphysics® software to find out how the baked Alaska works.

The Baked Alaska: Combining Hot and Cold in One Dessert
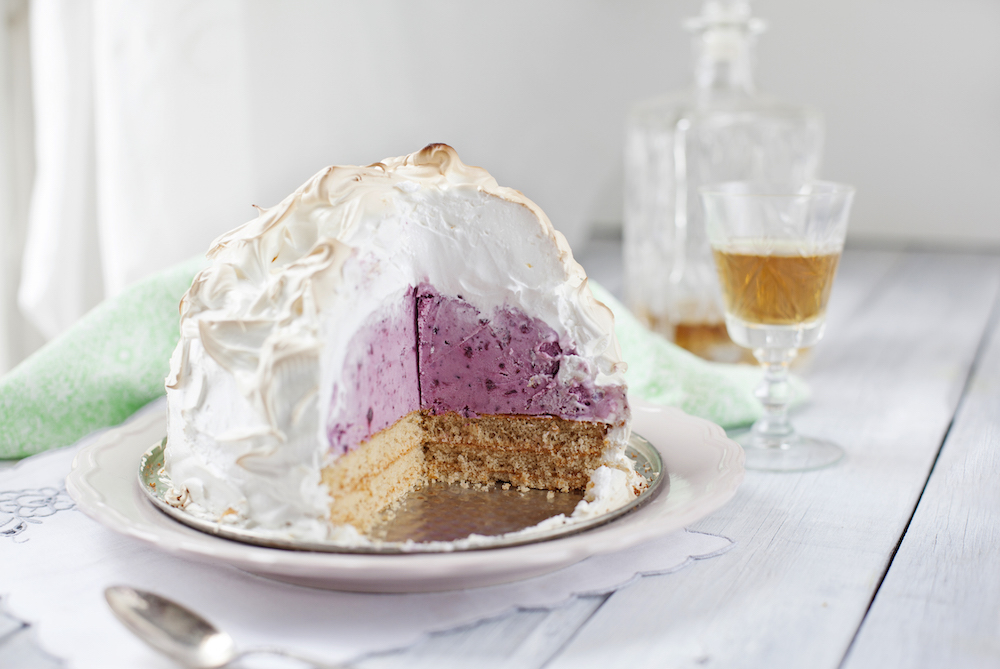
The lavish baked Alaska is made by placing ice cream in a pie dish or, for the classic dome shape, a bowl. Then, you cover the ice cream with slices of sponge cake to form the bottom of the dessert. Next, you flip the ice cream and sponge cake upside down and onto a flat dish and cover the ice cream with meringue (egg whites and sugar whipped to a stiff foam) as if you were frosting a cake. The entire dessert is put into a really hot oven long enough for the meringue to caramelize, but short enough to keep the ice cream from melting.
 A classic dome-shaped baked Alaska, with a layer of caramelized meringue around the ice cream.
As the story goes, the name “baked Alaska” was coined in 1867 at Delmonico’s restaurant in New York City to celebrate the recent acquisition of Alaska from the Russian Empire. The true origin of the baked Alaska, however, has always been up for debate.
Analyzing Heat Transfer in the Baked Alaska Using COMSOL Multiphysics®
For the geometry of our baked Alaska model, we use a half sphere for the dessert’s common dome shape. The geometry includes a layer of sponge cake at the bottom and a layer of meringue covering the dome-shaped ice cream. The thickness of the meringue layer is added as a parameter so that it will be easy to vary. The thickness is initially set to 2 cm.
For the same reason, the oven temperature is also added as a parameter and is initially set to 250°C. Some recipes call for an oven temperature of around 220°C and a cooking time of about 8 to 10 minutes, whereas other recipes use a higher temperature of around 250°C and just a couple of minutes in the oven. Our simulations will show whether the dessert comes out as expected in both cases.
We set up a time-dependent heat transfer simulation using the Heat Transfer in Solids interface in COMSOL Multiphysics. As input to the simulation, we need to provide the density, thermal conductivity, and heat capacity for the ice cream, meringue, and sponge cake. The values used in this simulation come from the book The Kitchen as Laboratory: Reflections on the Science of Food and Cooking, edited by Vega et al.
The material properties are added to three Material nodes, which are assigned to the domains in the geometry that represent the ice cream, meringue, and sponge cake, respectively. From the data, the meringue and the sponge cake are equally poor thermal conductors, which means they both provide ample thermal insulation covering the ice cream.
For modeling heat transfer, the Heat Transfer in Solids interface uses the material properties from the respective materials.
The initial temperatures are set to -18°C for the ice cream (a typical freezer temperature), 8°C for the meringue (typical if using eggs that have been stored in a refrigerator), and 20°C (room temperature) for the sponge cake.
For the boundary conditions, a heat flux with a large heat transfer coefficient represents the convective heat flux in the oven affecting the temperature of the baked Alaska.
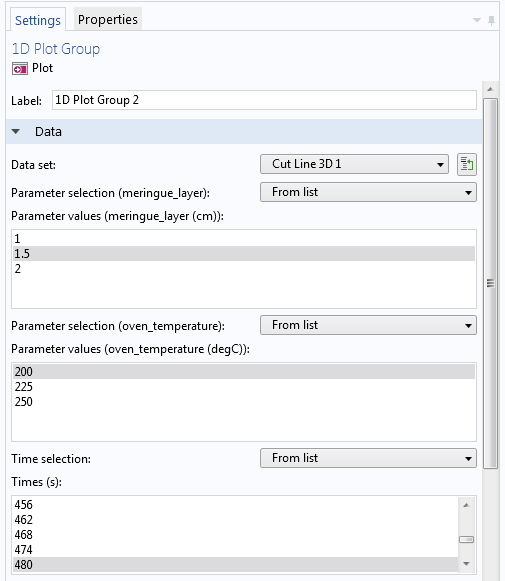
We can set up a time-dependent study to simulate the temperature in the baked Alaska from the moment it is put in the oven to the point where it has stayed there for 12 minutes, which is a bit beyond what would be required according to most recipes. In addition, a full parametric sweep is added to analyze the effects of varying the meringue layer and the oven temperature. The following shows how you can choose to plot the temperature distribution from any combination of those two parameters and the time.
 Selecting values for the thickness of the meringue layer, oven temperature, and time for a fully parametric time-dependent simulation.
As the primary result from the simulation, the temperature in the entire baked Alaska can be displayed as a volume plot, as shown below.
The temperature field (in degrees Celsius) inside the baked Alaska after 4 minutes with a meringue layer of 2 cm and an oven temperature of 250°C.
Next, we perform a more quantitative analysis using a cross-sectional temperature profile. As an extension of this model, we also show an example of how to vary one of the initial temperatures to analyze what happens if the ice cream has been left to thaw for a while before putting the baked Alaska in the oven.
I Conquer the BAKED ALASKA: The World’s Most Challenging Dessert
FAQ
Why is the baked Alaska so difficult?
Why does ice cream not melt in baked Alaska?
What is the science behind baked Alaska?
What does baked Alaska taste like?
